 ) is calculated as:
1) Age-specific adult mortality rates.
2) Age 15-49 years total mortality rate.
Coverage:
Population base: Women and men age 15-49 years (IR file)
Time period: Seven-year periods preceding the survey, excluding the month of interview. Typically, 0-6 years preceding the survey (v008-1 to v008-84), but other time periods may also be calculated such as 7-13 years, 0-13 years, 0-10 years preceding the survey. Description below is for 0-6 years preceding the survey
Numerator:
Number of siblings of respondents who died in the period 0-6 years prior to the interview by five-year age group at time of death, disaggregated by sex.
Deaths are tabulated according to period of death and the age of sibling at the time of the death:
Period of death: The period of death is calculated as the difference in months between the date of interview and the date of death of the sibling, both in century month code (CMC) format. Deaths of siblings are included if they occurred within the period of interest (v008-84 <= mm8 <= v008-1).
Age of sibling at the time of the death: The difference in months between the date of death of the sibling and the date of birth of the sibling, both in CMC. The difference is then divided by 60 and truncated to whole numbers to form the age groups ( int( ( m8 - m4 ) / 60 ) ). Deaths are tabulated by age group.
Denominator:
Number of person-years of exposure of siblings of respondents during the period 0-6 years prior to the survey by five-year age group, disaggregated by sex.
Person-years of exposure are calculated as the sum of the number of months exposed in the five-year age group during the time period divided by 12. A sibling can contribute exposure to two or three five-year age groups during an 84-month period.
Variables: IR file.
|
v008 |
CMC Date of interview |
|
mm1 |
Sex of sibling |
|
mm2 |
Survival status of sibling |
|
mm4 |
Sibling's date of birth (CMC) |
|
mm8 |
Date of death of sibling (CMC) |
|
v005 |
Women's individual sample weight |
The data for calculating adult mortality are based on reports of siblings from the survey respondents, collected in the sibling history. The sibling history is stored as part of the individual recode dataset (IR file). Before using the sibling history, it is necessary to transform the sibling history data into a dataset where the sibling, rather than the survey respondent, is the unit of analysis. In Stata this is done with the reshape long command and in SPSS with the varstocases command.
Period:
First determine the limits of the time period and the total exposure in the time period. The limits for the 0-6 year period are the date of interview minus 60 months and the date of interview minus one month (lowlim = v008 - 84, upplim = v008 - 1). If the sibling had died the upper limit is replaced with the date of death of the sibling (upplim = mm8 if mm2 = 0). The total exposure is the difference between the upper and lower limits plus one month (exposure = upplim - lowlim + 1). If the total exposure is negative because the sibling died before the start of the period the total exposure is 0 (exposure = 0 if exposure < 0), and the sibling will not be included in the numerator or denominator.
Numerator (deaths):
For each dead sibling:
· Number of deaths of siblings in the period (death1 = (mm2 = 0 & exposure > 0)).
· Age at death is determined directly from the response by classification into 5 year age groups (agegroup = int( ( m8 - m4 ) / 60 )).
· Period of death is determined by using the sibling’s date of death.
Deaths at ages less than 15 years (agegroup < 3) or more than 49 years (agegroup > 9) are not tabulated as are deaths occurring earlier or later than the period (lowlim <= mm8 <= upplim).
Denominator (exposure):
The exposure in each age group is then calculated for each of up to 3 five-year age groups (for periods of up to 10 years – beyond 10 years additional age groups would be needed).
Highest age group:
· A surviving sibling’s age at the end of the period determines the highest age group. The highest age group is calculated by subtracting the sibling’s date of birth from the upper limit of the period (for 0-6 year period this is the date of interview minus one in CMC), dividing the difference by 60 and truncating to a whole number (agegrp1 = int( (upplim - mm4) / 60), where upplim = v008 - 1. For dead siblings this will be the same as agegroup above).
· The exposure or number of months spent in the highest age group is the difference in months between the age at the end of the period of exposure (date of interview less one month) and the lower age limit of the age group plus one month (expo1 = upplim - (mm4 + agegrp1*60) + 1). If the sibling had died, the total exposure may be reduced as some exposure occurred outside the period of interest – the exposure for the age group is reduced to the total exposure (expo1 = min(exposure, expo1)).
· The remaining exposure is the total exposure minus the exposure in the highest age group (rem_exposure = exposure - expo1).
Middle age group:
· A surviving sibling’s age at the end of the period less 60 months determines the middle age group (agegrp2 = agegrp1 - 1). The middle age group can also be calculated by subtracting the sibling’s date of birth from the end of the period minus 60 months (date of interview minus 61 in CMC), dividing the difference by 60 and truncating to a whole number (agegrp2 = int( (upplim - 60 - mm4) / 60), however the first calculation is simpler and is mathematically identical.
· The exposure or number of months spent in the middle age group is the difference in months between the age at the end of the period of exposure less 60 months (date of interview minus 61 months for living siblings) and the lower age limit of the age group plus one month. More easily, the exposure is the minimum of the remaining exposure and 60 (expo2 = min(rem_exposure, 60)).
· If the sum of number of months exposed in both the highest and middle age groups is less than 84, then the sibling contributes exposure to both the middle age group and the lowest age group. The remaining exposure is the total exposure minus the exposure in the highest and middle age groups, or just the remaining exposure after the highest age group minus the exposure in the middle age group (rem_exposure = rem_exposure - expo2).
Lowest age group:
· The lowest age group is one less than the middle age group (agegrp3 = agegrp2 - 1).
· The contribution to the lowest age group is just the remaining exposure (expo3 = rem_exposure).
For other periods (7-13 years and 0-13 years prior to survey): The limits of the periods and the durations of the periods are adjusted accordingly. For the 0-13 year period, there are two middle age groups.
Tabulation: Each sibling is tabulated up to three times, once according to her/his highest age group accumulating the exposure she/he contributes to that group, once in the middle age group accumulating middle age group exposure, and once in the lowest age group accumulating lowest age group exposure. In Stata and SPSS this can be achieved by transforming the sibling history data into a dataset of age groups using reshape long in Stata or varstocases in SPSS and counting the deaths in the highest age group (death1, setting death2 = 0 and death3 = 0 for the middle and lower age groups) before transforming the data.
For ever-married samples, all women factors are applied in the tabulation of both the numerators and the denominators.
Once the numerators and denominators are properly established, age-specific mortality rates are obtained by the division of the numerators by the corresponding denominators and multiplying by 1000. The general mortality rate for age 15-49 is obtained by multiplying the age-specific mortality rates by the proportion of respondents in the five-year age group and then summing the age-distribution-adjusted mortality rates.
Example: Calculation of working variables for individual siblings based on DHS model dataset
|
sibling |
mm1 |
mm2 |
mm4 |
mm8 |
lowlim |
upplim |
exposure |
agegrp1 |
expo1 |
death1 |
agegrp2 |
expo2 |
agegrp3 |
expo3 |
|
1 |
1 |
1 |
876 |
|
1302 |
1385 |
84 |
8 |
30 |
0 |
7 |
54 |
6 |
0 |
|
2 |
1 |
1 |
912 |
|
1302 |
1385 |
84 |
7 |
54 |
0 |
6 |
30 |
5 |
0 |
|
3 |
1 |
1 |
960 |
|
1302 |
1385 |
84 |
7 |
6 |
0 |
6 |
60 |
5 |
18 |
|
4 |
2 |
1 |
1044 |
|
1302 |
1385 |
84 |
5 |
42 |
0 |
4 |
42 |
3 |
0 |
|
5 |
2 |
1 |
1068 |
|
1302 |
1385 |
84 |
5 |
18 |
0 |
4 |
60 |
3 |
6 |
|
6 |
1 |
1 |
1080 |
|
1302 |
1385 |
84 |
5 |
6 |
0 |
4 |
60 |
3 |
18 |
|
7 |
2 |
0 |
1111 |
1356 |
1302 |
1356 |
55 |
4 |
6 |
1 |
3 |
49 |
2 |
0 |
|
8 |
2 |
1 |
1056 |
|
1302 |
1385 |
84 |
5 |
30 |
0 |
4 |
54 |
3 |
0 |
|
9 |
1 |
1 |
1092 |
|
1302 |
1385 |
84 |
4 |
54 |
0 |
3 |
30 |
2 |
0 |
|
10 |
1 |
1 |
1152 |
|
1302 |
1385 |
84 |
3 |
54 |
0 |
2 |
30 |
1 |
0 |
The above example provides the results of the calculations of the working variables for the first 10 records in the DHS model IR dataset, based on a date of interview (v008) of June 2015 (cmc 1386). The total exposure is 84 months for all siblings except those that have died. In the example, the 7th sibling died in December 2012 (mm8 = 1356) and was only exposed 55 months in the period. For the 1st case the sibling contributes 30 months in age group 8 (40-44), and 54 months in age group 7 (35-39). The 3rd case contributes 6 months in age group 7 (35-39), 60 months in age group 6 (30-34) and 18 months in age group 5 (25-29). The 7th case contributes 6 months and 1 death in age group 4 (20-24) and 49 months in age group 3 (15-19).
To tabulate the deaths and exposure by age group and sex, the age group, exposure and death data above is transformed into a file by age group as below, selecting only age groups 3 – 9 to exclude any exposure outside of the age range 15-49.
|
sibling |
index |
sex |
agegrp |
expo |
death |
|
1 |
1 |
1 |
8 |
30 |
0 |
|
1 |
2 |
1 |
7 |
54 |
0 |
|
1 |
3 |
1 |
6 |
0 |
0 |
|
… |
… |
… |
… |
… |
… |
|
6 |
1 |
1 |
5 |
6 |
0 |
|
6 |
2 |
1 |
4 |
60 |
0 |
|
6 |
3 |
1 |
3 |
18 |
0 |
|
7 |
1 |
0 |
4 |
6 |
1 |
|
7 |
2 |
0 |
3 |
49 |
0 |
|
… |
… |
… |
… |
… |
… |
From this file the deaths and exposure at each age group and sex are tabulated and the adult mortality rate is calculated as the ratio of the deaths over the exposure.
Siblings whose sex or survival status is missing or unknown to the respondent are excluded from both numerators and denominators. Dates of birth are calculated from current age for living siblings and age at death and number of years ago sibling died for dead siblings. Dates of birth and death are imputed where age, age at death, or number of years ago is missing or unknown, taking into consideration the sibling’s birth order.
The DHS adult and maternal mortality questionnaire module collects information from respondents (female and, in some surveys, male) about all of their siblings born to the same mother, starting with the oldest. For living siblings, the upper and lower bounds of the date of birth in the recode data file are calculated by subtracting the age from the date of interview for the upper bound, and the upper bound minus 11 months for the lower bound. For dead siblings, the upper and lower bounds of the date of birth are calculated by subtracting the sum of the responses on age at death and the number of years ago the death occurred from the date of interview for the upper bound, and the upper bound minus 23 months for the lower bound. To calculate the upper and lower bound of the date of death, the number of years ago the death occurred is subtracted from the date of interview for the upper bound, and the upper bound minus 11 months for the lower bound. After these calculations, month of date of birth and date of death are assigned by midpoint imputation between lower and upper bounds of the dates calculated and making sure that the birth order and minimum birth intervals are maintained between dates of birth of the siblings.
The age distribution of siblings is very different than the age distribution of the population since only eligible women (and in some surveys, men) can report on their siblings. For example, if a girl or boy is sixteen years old and has only siblings younger than 15 years, she or he will not be represented. The same holds true at the upper end of the eligible age range. Thus, the age distribution of siblings is a curve with minimums at the ends of the eligible age range of respondents and a maximum at about the midpoint of the eligible age range (30 to 35 years). In order to properly calculate general or total rates, age-specific rates must be adjusted to a more representative age distribution. The distribution of respondents is used for this adjustment.
One might think that the calculation of mortality rates is biased because the (living) respondent is not included. Similarly, people with no siblings are not included since there is no one to report on them. However, it has been shown by James Trussell and German Rodriguez (1990) that these two potential biases cancel each other out, under the assumption that mortality rates are unrelated to the size of the sibship.
Another important issue is location. The DHS Program does not collect information on the residence of siblings who died nor on the residence, during the exposure period, of living and dead siblings. The residence of respondents at the time of interview is not necessarily the same as that of their siblings. Therefore, The DHS Program usually does not publish adult mortality rates by region or residence.
Moultrie T.A., R.E. Dorrington, A.G. Hill, K. Hill, I.M. Timæus and B. Zaba (eds). 2013. Tools for Demographic Estimation. Paris: International Union for the Scientific Study of Population.
http://demographicestimation.iussp.org/content/estimation-adult-mortality-sibling-histories
Pullum, T., S. Assaf, and S. Staveteig. 2017. Comparisons of DHS Estimates of Fertility and Mortality with Other Estimates. DHS Methodological Reports No. 21. Rockville, Maryland, USA: ICF. https://www.dhsprogram.com/publications/publication-MR21-Methodological-Reports.cfm
Trussell J. and G. Rodriguez. 1990. “A Note on the Sisterhood Estimation of Maternal Mortality.” Studies in Family Planning, 21, 6: 344-346.
United Nations. 2002. Methods for estimating adult mortality. Working Paper No. ESA/P/WP.175. https://www.un.org/en/development/desa/population/publications/pdf/mortality/estimating-adult-mortality.pdf
DHS-8 Tabulation plan: Table MM.1
API Indicator IDs:
Female:
MM_AMRT_W_DTH, MM_AMRT_W_EXP, MM_AMRT_W_AMR
Male:
MM_AMRT_M_DTH, MM_AMRT_M_EXP, MM_AMRT_M_AMR
(API link, STATcompiler link)
The probability of dying between the ages of 15 and 50 for women and men during the seven years preceding the survey.
Coverage:
Population base: Women and men age 15-49 (IR file)
Time period: 7 years preceding the survey
Numerators: See Numerators for Adult Mortality Rates
Denominator: See Denominators for Adult Mortality Rates
Variables: IR file.
|
v008 |
CMC Date of interview |
|
mm1 |
Sex of sibling |
|
mm2 |
Survival status of sibling |
|
mm4 |
Sibling's date of birth (CMC) |
|
mm8 |
Date of death of sibling (CMC) |
|
v005 |
Women's individual sample weight |
The adult mortality rates are first calculated as described in Adult Mortality Rates. The probability that an individual will die in an age group x () is calculated as:
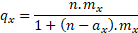
where the  are the adult mortality rates for each age group, n is the width of the age group (5 years), and ax is the average number of years lived in the age group by those dying in the age group. A simple assumption would be to use 2.5 for ax, but in real populations, within the age range 15-49, it is more than 2.5 and it increases as age increases. As an approximation The DHS Program uses 2.6 for a. Thus, the formula used is:

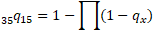
The probability of dying between exact ages 15 and 50 is then
See Handling of Missing Values for Adult Mortality Rates
See Notes and Considerations for Adult Mortality Rates
Moultrie T.A., R.E. Dorrington, A.G. Hill, K. Hill, I.M. Timæus and B. Zaba (eds). 2013. Tools for Demographic Estimation. Paris: International Union for the Scientific Study of Population.
http://demographicestimation.iussp.org/content/estimation-adult-mortality-sibling-histories
Shryock, H. S., J. S. Siegel, and associates. 1976. The Methods and Materials of Demography. New York: Academic Press.
DHS-8 Tabulation plan: Table MM.2
API Indicator IDs:
MM_AMPB_W_AMP, MM_AMPB_M_AMP
(API link, STATcompiler link)