
Percent distribution of the de facto female and male household population age 6 and over by highest level of schooling attended or completed.
Coverage:
Population base: De facto female and male household members age 6 and over (PR file)
Time period: Current status at time of survey
Numerator: Number of de facto females or males age 6 and over distributed by level of schooling attended or completed (hv109, hv103 = 1 & hv105 in 6:99)
Denominator: Number of de facto females or males age 6 and over (hv103 = 1 & hv105 in 6:99)
Variables: PR file.
|
hv103 |
Slept last night |
|
hv104 |
Sex of household member |
|
hv105 |
Age of household members |
|
hv109 |
Educational attainment |
|
hv005 |
Household sample weight |
Numerator divided by the denominator, multiplied by 100.
Missing data and “don’t know” responses are grouped into a separate category in the percent distribution.
Years of education considered for completion of each level of education vary from country to country and may change over time within country. Education levels are also country-specific. Respondents are asked the highest level of schooling attended and the highest grade completed at that level.
DHS-8 Tabulation plan: Tables 2.11.1 and 2.11.2
API Indicator IDs:
Women:
ED_EDAT_W_NED, ED_EDAT_W_SPR, ED_EDAT_W_CPR, ED_EDAT_W_SSC, ED_EDAT_W_CSC, ED_EDAT_W_HGH, ED_EDAT_W_DKM, ED_EDAT_W_PRI, ED_EDAT_W_SEC
Men:
ED_EDAT_M_NED, ED_EDAT_M_SPR, ED_EDAT_M_CPR, ED_EDAT_M_SSC, ED_EDAT_M_CSC, ED_EDAT_M_HGH, ED_EDAT_M_DKM, ED_EDAT_M_PRI, ED_EDAT_M_SEC
Median years of education for the de facto female and male household population age 6 and over.
Coverage:
Population base: De facto female and male household members age 6 and over (PR file)
Time period: Current status at time of survey
Numerator: Number of de facto females or males age 6 who attended or completed any school according to the number of years completed (hv108 if hv103 = 1 & hv105 in 6:99 & hv108 in 0:96)
Denominator: Number of de facto females or males age 6 and over (hv103 = 1 & hv105 in 6:99 & hv108 in 0:96)
Variables: PR file.
|
hv103 |
Slept last night |
|
hv104 |
Sex of household member |
|
hv105 |
Age of household members |
|
hv108 |
Education completed in single years |
|
hv005 |
Household sample weight |
Medians are calculated from cumulated single-year percent distributions (see Numerator and Denominator above) of completed years of schooling. The median is linearly interpolated between the years of completed schooling that occur before and after a cumulative 50 percent:
median
The table below shows the cumulative (weighted) percentage of women age 15-19 by completed years of schooling. We look for two successive cumulative percentages that bracket 50%. We find that 41.6% of women age 15-19 have completed 6 years of schooling and 54.6% completed 7 years of schooling. We find the median by interpolating between the two numbers of completed years.
|
Completed years of education |
Frequency |
Percentage of de facto females age 15-19 |
Cumulative percentage of de facto females age 15-19 |
|
0 |
375 |
18.6 |
18.6 |
|
1 |
8 |
0.4 |
19.0 |
|
2 |
17 |
0.8 |
19.8 |
|
3 |
40 |
2.0 |
21.8 |
|
4 |
67 |
3.3 |
25.2 |
|
5 |
115 |
5.7 |
30.9 |
|
6 |
217 |
10.8 |
41.6 |
|
7 |
262 |
13.0 |
54.6 |
|
8 |
357 |
17.7 |
72.3 |
|
9 |
226 |
11.2 |
83.5 |
|
10 |
172 |
8.5 |
92.0 |
|
11 |
93 |
4.6 |
96.6 |
|
12 |
66 |
3.3 |
99.9 |
|
13 |
2 |
0.1 |
100.0 |
median 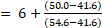
median 
Missing data and “don’t know” responses for the highest level of education attended or the highest grade completed are excluded from the median calculation.
Filmer, D., and L. Pritchett. 1999. "The effect of household wealth on educational attainment: evidence from 35 countries." Population and development review 25(1): 85-120.
DHS-8 Tabulation plan: Tables 2.11.1 and 2.11.2
API Indicator IDs:
ED_EDUC_W_MYR, ED_EDUC_M_MYR