- ABOUT THE DATA
- UNDERSTANDING SURVEY STATISTICS
- WORKING WITH DATASETS
- DATASET ACCESS
Ishor Sharma
Nepal Demographic and Health Surveys
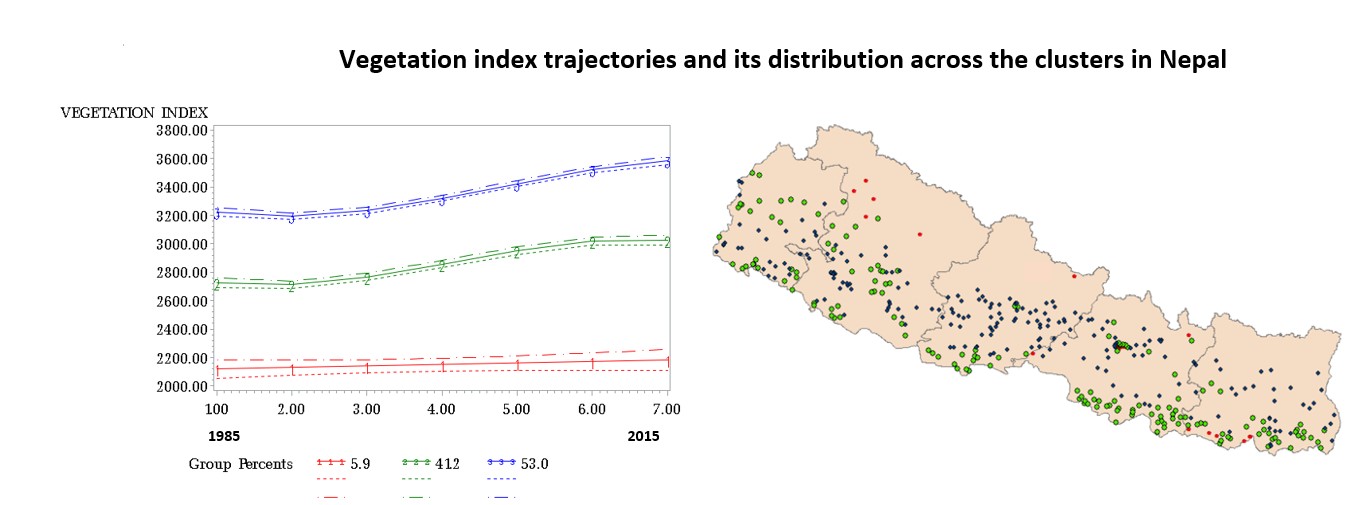
"The graph was plotted using the latent class growth modeling with the objective of classifying clusters (n=383) based on their vegetation index trajectory over the period of 30 years (1985 and 2015). In general, graph shows three different vegetation index trajectory; red lines (representing almost 6% of the clusters) showed no change in the vegetation index in the last 30 years. Blue graph represents 53% of the clusters and shows higher levels of vegetation index and is in increasing trend. The green lines in the middle representing almost 41% of the cluster, shows the intermediate levels of vegetation index and also in an increasing trend. The spatial map on the right shows the distribution of these clusters across Nepal."
See more in our World Fertility Survey 50th anniversary data visualization showcase.
Download Datasets
The DHS Program is authorized to distribute, at no cost, unrestricted survey data files for legitimate academic research. Registration is required for access to data.
Guide to Using Datasets
